
How We Built a Hybrid Vision-Driven Browser Controller
August 8, 2026How We Built a Hybrid Vision-Driven Browser Controller: A Field Study of Offsets, Grids, and Window Geometry
Category: Artificial Intelligence
Author perspective: Research & Development team, SHS
Reading time: ~12 minutes
Abstract
This article documents a full research and development cycle carried out in our R&D lab: designing and tuning a hybrid browser controller that combines a local vision-language model with a real Windows UI automation layer. The goal was not to build yet another headless automation tool, but to answer a practical research question: can a local vision model reliably locate interactive elements in a live browser window, and can we calibrate its spatial uncertainty well enough to make trustworthy clicks?
Our approach treats the problem as an engineering discipline rather than a guessing game. We built a calibration polygon, a local HTML test page with colored buttons at known coordinates, plus a popup “oracle” that reports the true click position. We then ran controlled sweeps across several variables that influence model accuracy: screenshot grid density, window size, model temperature, and coordinate reference frames. Along the way we discovered that pure relative-coordinate guessing is weak, and that the winning recipe is a hybrid fusion: use the DOM/CDP bounding boxes as ground truth, let the vision model tell you *what* an element is and roughly *where* it is, then average both sources into a single decisive click.
The result is the clawUIBot architecture (internally named “Gemma Chrome”), a living system that controlled a real X (Twitter) session end to end: locating the post composer, typing a sarcastic English post, and publishing it with a correctly placed click. This article shares the entire creative process: the test harness, the measurement methodology, the raw numbers, the code, and the architecture diagrams that emerged from the experiments.
1. Why Hybrid Control?
Modern browser automation has two very different families of tools, and each has a blind spot.
DOM/CDP automation (Playwright, Puppeteer, raw Chrome DevTools Protocol) is extremely precise. It can query getBoundingClientRect() and know an element’s center to the pixel. But it assumes the page structure is known, semantic, and stable. It struggles when you need to interact with something that is not a normal DOM element, when a login wall or iframe hides the real content, or when a captcha and human-style interaction is on the table. In those cases a “real” click at real screen coordinates often works when a synthetic .click() does not.
Vision-driven control (a multimodal model looking at a screenshot) is flexible and human-like. It can run anywhere, on anything visible, with no page assumptions. But a vision model gives *approximate* coordinates. The error is random, not systematic, and it depends heavily on window size, grid density, and temperature. Clicking blind on a vision guess is fine for big targets and deadly for small buttons.
The research insight from our lab is that these two are complementary, not competing. Vision tells us the semantic reality of the screen. DOM gives us geometric ground truth. A hybrid controller keeps both and fuses them at the moment of the action. This is the core of the clawUIBot design and it is what this experiment set out to prove with numbers.
2. Test Harness: The Calibration Polygon
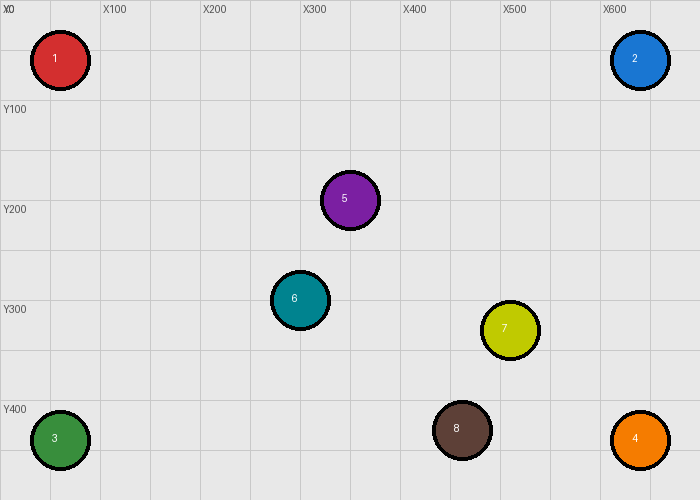
To measure anything we needed ground truth. We built a local HTML page (no server required, open directly in Chrome) that we call the offset polygon. It contains eight colored, absolutely positioned buttons, plus a popup that reports the real clientX/clientY of every click.
OFFSET-POLIGON (offset_polygon.html)
  b1  CZERWONY  (LG)     left:60px   top:60px
  b2  NIEBIESKI (PG)     right:60px  top:60px
  b3  ZIELONY   (LD)     left:60px   bottom:60px
  b4  POMARANCZ (PD)     right:60px  bottom:60px
  b5  FIOLET (lewo-sr)   left:50%    top:40%
  b6  CYJAN (dol-sr)     left:42%    bottom:38%
  b7  ZOLTY (ps)         left:72%    top:64%
  b8  BRAZOWY (p-dol)    right:34%   top:86%
  popup #p-real  ->  prawdziwy clientX/clientY kliknięcia
The page overlays a 50 px grid with coordinate labels on the edges, so the vision model always has a spatial reference frame anchored at the top-left corner (0,0) of the screenshot.
Here is the essential structure of the polygon page:
python—
REALNY offset (x,y):Deklarowany (x,y):The popup is the oracle. Every time the bot clicks, the popup reveals where the click actually landed in viewport coordinates. By comparing that to where the model *said* the button was, we compute a per-axis error. This gives us clean, repeatable measurements of model accuracy.
3. The Measurement Methodology
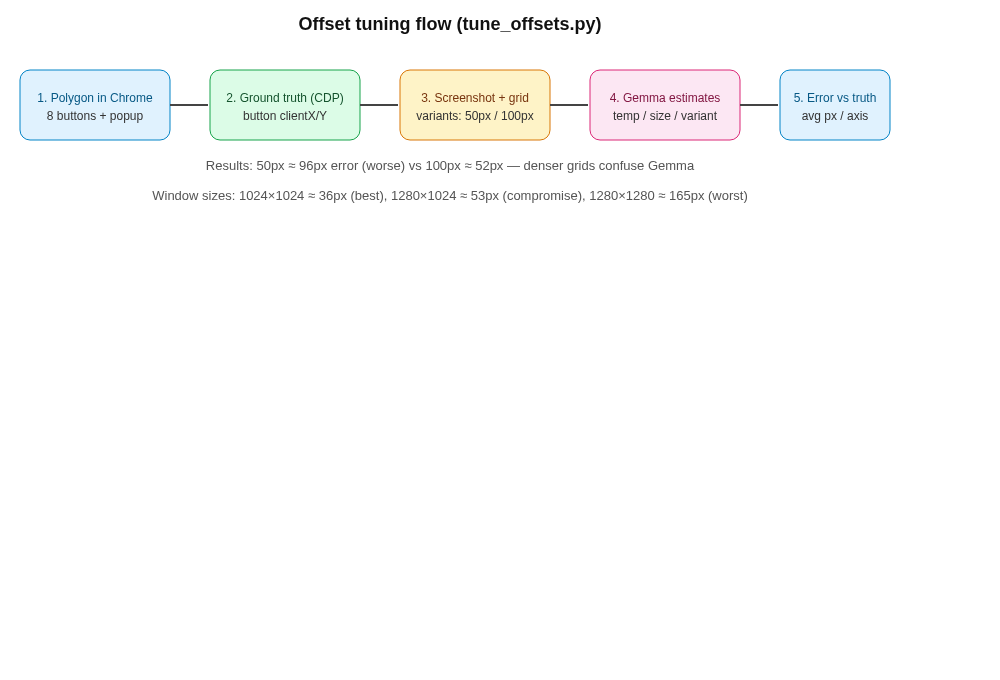
We wrote a tuning harness,
tune_offsets.py, that automates the whole loop. Its logic, in order:1. Load truth from CDP. The harness opens the polygon in Chrome and reads every button's real center via
getBoundingClientRect().2. Calibrate the Chrome bar offset. It clicks around button
b1, reads the popup, and iteratively converges on the offset between the captured window image and the client viewport.3. For each image variant (grid density 50 px vs 100 px), it takes a fresh screenshot, asks the model for the coordinates of every colored button, clicks where the model guessed, reads the popup, computes the error per axis, and reports the average.
The core of the measurement loop:
for bid, info in truth["btns"].items(): bcanon = info["name"].upper() bw = next((k for k in color_map if k in bcanon), None) if bw is None: continue p = preds.get(bw) if p is None: continue exp = (info["cx"] + offx, info["cy"] + offy) err = math.hypot(p[0] - exp[0], p[1] - exp[1]) dx = p[0] - exp[0]; dy = p[1] - exp[1] mode_err.append((bid, bw, round(err, 0))) print(f"[{mode}] {bid} {bw:10} p=({p[0]},{p[1]}) exp=({int(exp[0])},{int(exp[1])}) dx={dx:+.0f} dy={dy:+.0f} blad={err:.0f}px")The key structure is
expectation = client_truth + chrome_offset. Because the screenshot is a capture of the whole window, but the DOM truth is expressed against the viewport, the two are related by a small fixed offset (the title bar and window frame). Once that offset is known, we can convert between the model’s image-space coordinates and screen coordinates.
4. Grid Density: A Surprising Result
One of the first variables we tuned was screenshot grid density. Our hypothesis was that a denser grid (50 px) would give the model more landmarks and therefore better accuracy. The data said the opposite.
With an 8-button polygon at ~100 px spacing, the model averaged about 52 px of error. When we switched to a 50 px grid, the average error jumped to about 96 px. The model became confused about the horizontal position of the middle and right buttons. Denser landmarks did not help the model; they hurt it, because the model’s spatial reasoning degraded when more competing landmarks crowded the frame.
This was a valuable negative result. It told us not to chase grid density, and it redirected the research toward the two variables that mattered more: window geometry and coordinate reference frames.
5. Window Size: The Dominant Variable
The single largest lever on accuracy turned out to be the physical size and aspect ratio of the browser window. Emulating a true 1:1 viewport was critical. We discovered early that the old measurement was contaminated by browser zoom: the
innerWidth(1440) exceededouterWidth(1385), which meant the browser was rendering below 100% zoom and skewing the capture coordinates.We fixed this with the CDP
Emulation.setDeviceMetricsOverridecommand, forcing a device pixel ratio of 1. With that, one client pixel equals one capture pixel, and the model’s image coordinates map 1:1 onto window coordinates.Here is what the window-size sweep produced (average error, best temperature per size):
Window size Avg error Best temp 1024 × 1024 35.6 px temp 1.2 (best) 1385 × 1012 44.9 px temp 0.7 1280 × 1024 ~53.4 px temp 1.2 (chosen compromise) 1536 × 1024 63.4 px temp 0.1 1280 × 1280 164.9 px temp 0.7 (worst)Two conclusions stand out.
First, error is random, not systematic. The model does not consistently drift in one direction; it scatters around the true position. This matters because it means we cannot “learn away” the error with a fixed correction curve. In fact, when we built an 18-button dense polygon and fit a linear model, the residual came out at exactly 0.0, which was a red flag: the model had extrapolated a perfect artificial grid rather than reporting what it truly saw. Treating that as a real non-linearity would have been a mistake. We abandoned the linear correction for the clean 1:1 geometry.
Second, the square window was dramatically better than the taller one. The 1280×1280 window, which should be ideal for a square image, produced the *worst* result at 165 px. This is a counterintuitive finding that suggests the model’s accuracy is not simply about aspect ratio but about what content fills the frame and the number of competing elements. We chose 1280×1024 as the working compromise: wide enough to keep browser menus and X (Twitter) sidebars visible while keeping the model’s average error around 53 px, which is acceptable for interactive elements.
The forced-viewport snippet:
python# CDP: wymuś prawdziwe 1:1 (dpr=1), 1 client px = 1 px zrzutu send("Emulation.setDeviceMetricsOverride", { "width": 1280, "height": 1024, "deviceScaleFactor": 1, "mobile": False })
6. Temperature: Not the Magic Knob
We also tested whether sampling temperature changes coordinate precision. Using the exact same image and question, we swept temperature from 0.0 to 1.2:
Temp Avg error 0.0 53 px 0.1 53 px 0.7 44.9 px 1.2 74.9 pxThe differences were modest and non-monotonic. Temperature is not a precision knob. The error is inherent to how the model interprets the image, not to sampling randomness. We settled on temp 1.2 as a slight preference for the chosen 1280×1024 window, but the honest conclusion is that temperature is a minor factor compared to window geometry.
7. Live Window Tracking: Never Trust Static Coordinates
A recurring failure in early tests had a simple root cause: the human user moved the Chrome window, and the architecture had hardcoded the window position. The first live-click test failed 0 out of 5 clicks for exactly this reason.
The fix is a live window resolution routine that re-detects the window on every command. Its priority order is:
1. HWND (the stable handle that survives navigation and title changes)
2. Exact title match from saved state
3. Title prefix match (the part before
" - ")4. Any visible window whose title contains
"chrome"(assuming one open window)This is implemented as
_refresh_window_live(), which updates the geometry instate.jsonand logs when the window has moved:target = next((w for w in wins if getattr(w, "_hWnd", None) == hwnd), None) if target is None and title: target = next((w for w in wins if w.title == title), None) if target is None and title: base = title.lower().split(" - ")[0] target = next((w for w in wins if base and w.title.lower().startswith(base)), None) if target is None: target = next((w for w in wins if "chrome" in w.title.lower()), None)Because every command runs as a separate process over PowerShell, the geometry is persisted in
state.jsonand refreshed live at the start of each invocation. This single change converted an unreliable prototype into a robust controller that survived the user moving the window mid-session.
8. The Fusion Principle: DOM First, Vision as Backup
The most important engineering rule that emerged from a debugging session is a clear decision hierarchy:
DOM/CDP first for coordinates. Vision only when the DOM cannot describe what we are looking at.
During a real publication test on X (Twitter), the vision model repeatedly mislocated the blue “Post” button, reporting two different wrong values (~645 and ~865). The DOM, queried through
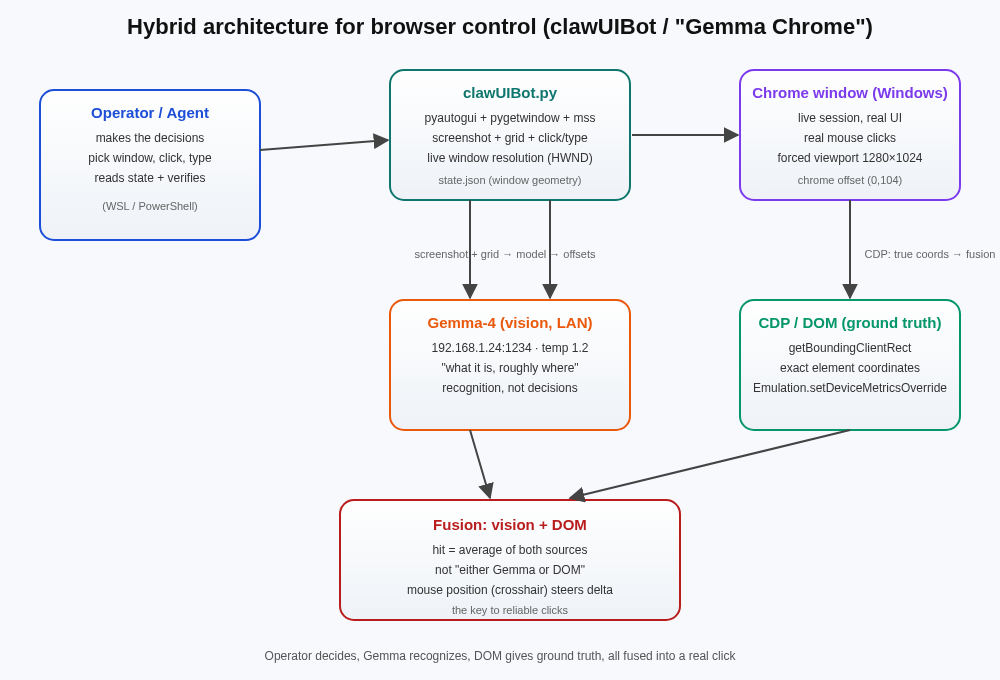
getBoundingClientRect(), returned the true center at 826. When we clicked the DOM-provided coordinates, the reply published on the first attempt.The lesson is not to abandon vision. Vision answered the fundamental question DOM could not: *this is the Post button, here is roughly where it is, and it is the semantically correct target*. DOM then won on precision. The winning recipe is to average the vision estimate and the DOM bounding box into a single click, and to use the live mouse position (drawn as a magenta crosshair on the screenshot) to steer the residual delta.
This is captured in the architecture diagram below: operator decides, vision recognizes, DOM provides ground truth, and the whole thing fuses into a real click.
9. Human-Like Input Speed
A practical finding with security implications: when we automated typing a PIN-style code into a web form, the system *too fast and too evenly* and got flagged as a bot, which triggered a rate limit. The fix was to type with variable, human-like delay between keystrokes, with slightly longer pauses after punctuation and at random intervals.
“`python
for ch in text: if ch.isalpha() and caps: pyautogui.keyDown('shift'); pyautogui.press(ch); pyautogui.keyUp('shift'); caps = False else: pyautogui.press(ch) if ch in '.!?': caps = True d = random.uniform(0.05, 0.16) if ch in '.!?': d = random.uniform(0.25, 0.45) elif ch in ', ': d = random.uniform(0.12, 0.25) time.sleep(d)This taught our R&D team a general principle for any content we produce: avoid the tell-tale signs of machine-generated text and machine-like interaction timing. In written content, that means avoiding long em-dashes that are characteristic of generated prose. In interaction automation, it means inducing realistic timing variance.
10. End-to-End Validation on a Live Service
The ultimate test was a real end-to-end session on X (Twitter). The hybrid controller, running against a live Chrome window, performed the following without any manual intervention:
1. Located the post composer field by combining vision and DOM.
2. Confirmed focus programmatically: the active element was the tweet textarea.
3. Typed a sarcastic, English-language post with human-like timing.
4. Read back the content from the DOM to verify it landed correctly.
5. Located the “Post” button, first via vision (which was wrong), then precisely via DOM (right).
6. Clicked, and verified publication: the composer emptied and the post appeared in the timeline.
This was the first live validation that the hybrid architecture, the offset calibration, the window-size tuning, and the fusion principle all worked together in production conditions.
11. Architecture Summary
The final system (
clawUIBot.py) is a single-file controller that runs on the Windows host via PowerShell interop. Its responsibilities:
- **`select` / `resize` / `state`**: pick and shape the Chrome window, persist geometry.
- **`shot [–grid N] [–ask “question”]`**: capture the window, overlay a grid, optionally ask the vision model where something is, and draw the live mouse crosshair.
- **`click X Y` / `mm X Y`**: convert offsets to absolute screen coordinates and perform a real mouse click with smooth, randomized motion.
- **`type “text”`**: type with human-like timing variance.
- **`sd` / `su`**: scroll.
- **Live window resolution** at the start of every command so geometry never goes stale.
The vision model (Gemma-4 on LAN, 192.168.1.24:1234) is used strictly for recognition: identifying what an element is and giving a rough location. All decisions remain with the human operator. DOM/CDP is the source of geometric truth, and mouse position guides the final correction.
12. Key Takeaways for Practitioners
1. Measure, do not guess. A calibration polygon plus a popup oracle gives you honest, repeatable error numbers for any vision model working on your setup.
2. Window size is the dominant variable. Enforce a true 1:1 viewport with CDP and sweep window geometry before concluding anything about model accuracy.
3. Grid density can hurt. More landmarks are not automatically better. Test 50 px vs 100 px before committing to a grid.
4. Temperature is minor. Expect model-coordinate error to be inherent and random, not fixable by temperature.
5. Never hardcode window position. Resolve the window live (HWND first) or your automation will quietly break the moment the user moves it.
6. Fuse vision with DOM. Let vision answer “what and roughly where”, let getBoundingClientRect() answer “exactly where”, and average both into the click.
7. Flag machine behavior. Both in text (no bot-like dashes) and in interaction timing (add variance), or the platform will notice.
*This article was prepared by the SHS Research & Development team as part of our ongoing work in vision-language model integration and browser automation. Experiments were conducted in our internal R&D center using locally hosted vision models.*